COMPUTER AIDED
THRUSTER
PERFORMANCE
ANALYSIS
version: 0.8.3
by Geraldo Ribeiro
<geraldo-ribeiro@uol.com.br>
28 Oct 2001
What is the CATPA?
The main motivation for this project was the need of improving
the quality of the reports to be delivered to the client.
The old system posesses good data acquisition capabilities, however,
its data treatment performance is quite poor. Another problem was
the data format, for that format had not been supplied by the actual maintenance
team of Scopix® software.
This project intends to improve the treatment of the data acquired by
Scopix® software making it easier and faster. The CATPA
will supply exports to several file formats, allowing the post processing
of the data for nearly all available software.
The best report feature is its format: It is in LaTeX2e to ensure the
longevity of the generated files and the compatibility with any operating
system.
What do I need to run CATPA?
Your system must be compatible with the following characteristcs.
-
In this version it is run under GNU/LINUX,
but in the future it will be available to other operational systems.
-
Data vizualization is made by a openGL
window.
-
The toolkit used to create the interface is the Fast
Light Tool Kit.
-
The plot driver is the GNUplot.
-
The text formatting language is the LaTeX2e.
Homepage
This homepage is hosted on http://catpa.sourceforge.net.
Newsgroups & Lists
Some newsgroups are avaliable to supply the lastest information
on the CATPA status.
To receive information about new releases, improvements and related
information you can subscribe the catpa-announce@lists.sourceforge.net
list.
Forums
-
Feature
Requests - For requisition and discussion of new features
to be added to CATPA.
-
CATPA
Development Talk - Those contributing to the CATPA codebase can talk
about issues, implementation, etc...
-
Feature
Announcements - Announcements and tips for new features provided by
CATPA. Monitor to get them via email.
-
CATPA
i18n - CATPA Internationalization. Please monitor this forum if you
can code/translate.
How to get the CATPA binaries?
In the project
page (http://sourceforge.net/projects/catpa/) several versions
of the binaries and user-guides are avaliable.
Installing the CATPA
On GNU/LINUX system just type
| rpm -ivh catpa-X.Y.Z-1.i386.rpm |
to install the version X.Y.Z.
Launching the main Application
To launch the main Application type catpa on an X
teminal. The password window is shown to prevent the manipulation of classified
data from non ``authorized'' users (in a multiuser system (like UNIX) several
users share storage devices, Applications, etc.).
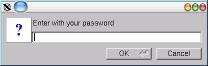
This password will limit the access to the test results and
log the user activity.
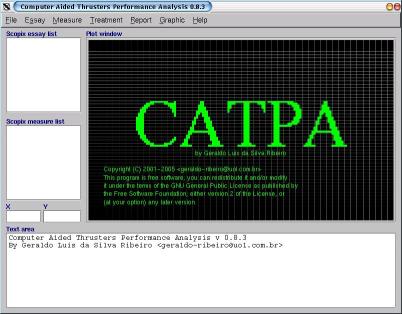
The main window is shown after you input the right password.
Creating a new base
A base is a group of tests. Before manipulating the data you
must create or open a test base. To create a new base choose
File
menu, then choose New base... option or press Ctrl+n.
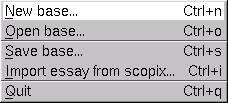
Then a dialog is shown prompting a file name.
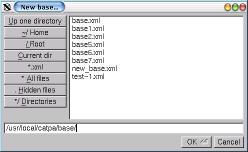
Importing a test result to the base
After the creation of the base you must import some Scopix®
test results to the base. To do this choose
Import test from scopix...
from the File menu or press Ctrl+i.

Go to the directory which contains the Scopix® test configuration,
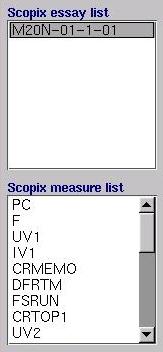
then click on Ok button. The name of the chosen test is shown on
the Scopix test list.
When you click over the name of the test all measurements acquired
in this test are shown on the Scopix measurements list.
Converting a raw file
Before you access the actual data (i.e., the physical measurements)
you must extract the bit shift values from the raw file and
convert them to float point format so that they will represent the physical
measurements.
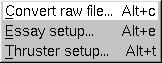
To convert the above data choose Convert raw file... option from
the Test
menu or press Alt+c.
Warning: This operation may take several minutes,
depending on your hardware.
While the conversion is taking place the status will show
information on the activity of the Application. After conversion,
the message Conversion done is shown.
Viewing a measurement
This conversion of the raw file enables the Application
to manipulate the data. Usually the first thing you want to do is
to look at the measurement value.To do this, you just click on the measurement
label in the Scopix measurement list box. A graphic showing all
values for the selected measurement is presented.
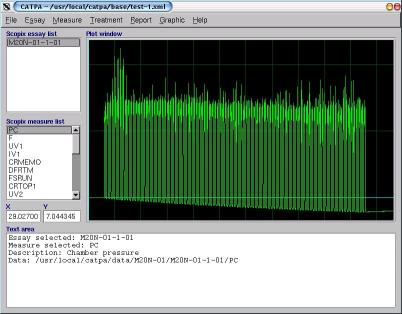
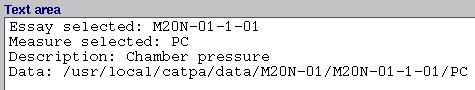
Some information about the measurement is also displayed on the Text
area.
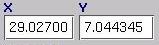
The fast access to the measurement value at any point is supplyed through
two features: a) a monospaced grid; and b) boxes for (X,Y) pair.
When you move the pointer over the Plot window the point coordinate
is shown in the X and Y boxes.
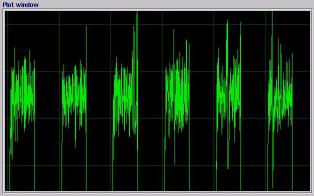
Zooming
To see a particular area in the graphic you must click with
the button 1 (left button) of your mouse and drag it over the chosen area.
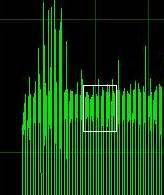
Making a choice such as the one shown above yields:
If you click with the button 2 (middle, not right button) of your mouse
or if you choose Axis setup... from the Graphic menu or if
you press Alt+a, the zoom settings dialog box is shown.
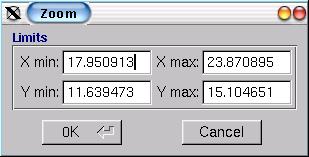
This dialog box shows the actual view settings, allowing the user to
set a new limit for the view.
Clicking the button 3 (right button) of your mouse over the Plot
window accomodates the whole curve.
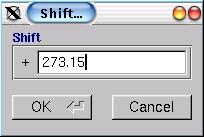
Shifting measurements
This Application supplies routines to apply shifts on the measurements.
| Example: The EWT (External Wall Temperature) measurement
was acquired in Celsius scale. To convert it to the Kelvin scale you must
choose
Apply shift... from the Measurement menu and fill
the input box with the conversion factor 273.15. |
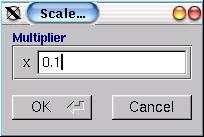
Scaling measures
This Application supplies routines to apply scales on the measurement.
| Example: The PT4501 (Cell Ambient Pressure) measurement
was acquired in bar. To convert it to MPa you must choose Apply scale...
from the Measurement menu and fill the input box with the conversion
coefficient 0.1. |
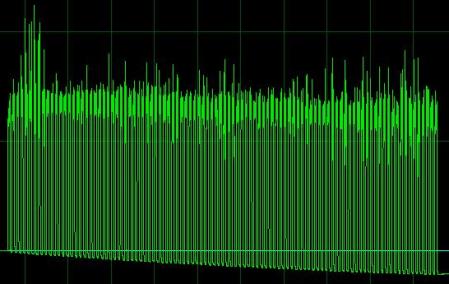
Drifting removal
An undesirable phenomenon called drift occurs on some
signals. This phenomenon can be atenuated by choosing Drift remotion
from the Measurement menu.
The original signal is shown below
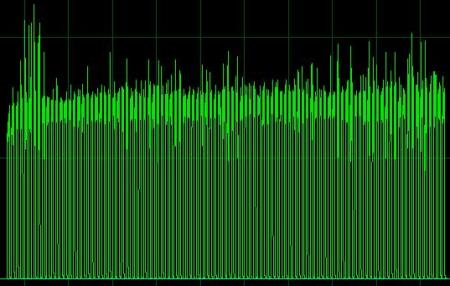
Then the corrected signal
Pulse description
Choosing Write pulse description from the menu Report,
a table describing the size of each pulse in the test is written on the
report file.
A fragment of this table is presented below
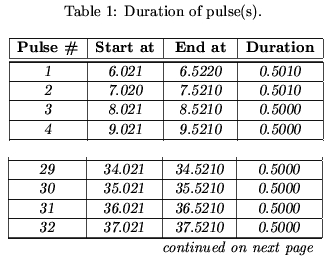
The first column indicates the pulse number. The second ant third
columns describe the beginning and ending of each pulse. The last
column shows the duration of each pulse.
Measurement tables
This Application has a routine to print measurements with a
regular preset step.
| Example: Print PC, F, UV1, IV1, UV2 and IV2.
Select this measurement holding the Ctrl key and choose the Write
table of selected measurements... from the Report menu.
A dialog box is shown asking for some parameter. |
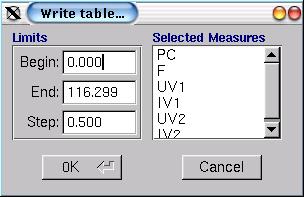
This dialog starts with the beginning of the test (0.0 s), its ending
and an arbitrary step (0.5 s). You may alter these values according to
your convenience.
Special thanks
|